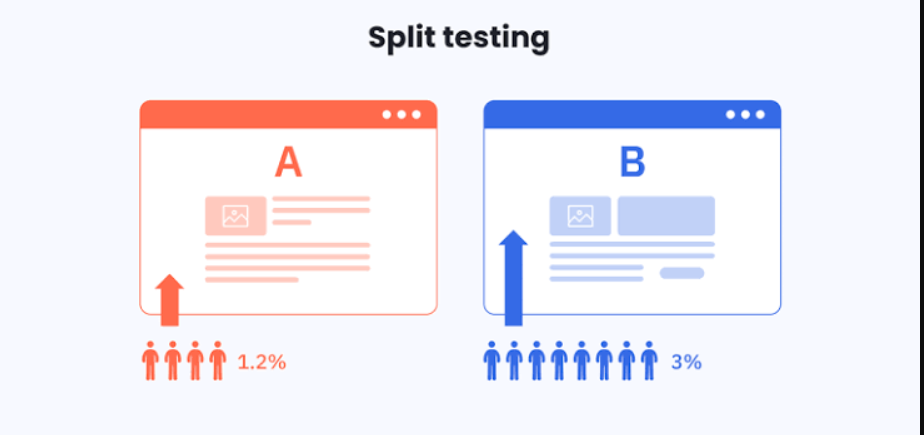
When a survey produces unexpected results, the first instinct is often to question the respondents. Did they misunderstand the questions? Were they distracted? Did they simply rush through the survey?
While those factors can affect data quality, the survey itself is often the real issue. Something as simple as changing the wording of a question, rearranging the order of questions, or shortening a form can significantly influence how people respond.
This is where split-sample testing becomes valuable.
Split-sample testing, also known as split-ballot testing, allows researchers to compare different versions of a survey using separate groups of respondents. Instead of relying on assumptions about what works best, researchers can measure which version generates higher-quality responses, better completion rates, and more reliable insights.
Whether you’re conducting academic research, measuring customer satisfaction, validating a product idea, or optimizing online forms, split-sample testing helps you make evidence-based improvements before rolling out a survey to a larger audience.
In this guide, you’ll learn what split-sample testing is, why it matters, how it works, common use cases, key performance metrics, mistakes to avoid, and best practices for running successful survey experiments.
What Is Split-Sample Testing?
Split-sample testing is a survey research method where a single sample of respondents is divided into two or more groups. Each group receives a slightly different version of the same survey, allowing researchers to compare the results and determine which version performs better.
The differences between survey versions are usually small and intentional. For example, you might change:
- The wording of a question
- The order of questions
- The response scale
- The length of the survey
- The call-to-action button
- The page layout
- The incentive offered for participation
Because each respondent only sees one version of the survey, researchers can isolate the impact of a single change without introducing unnecessary variables.
For example, imagine an online retailer wants to understand customer satisfaction after a purchase.
One group receives this question:
“How satisfied are you with your shopping experience today?”
Another group receives:
“Overall, how would you rate your experience with our online store?”
Although both questions measure customer satisfaction, the wording may influence how respondents interpret and answer the question. Split-sample testing helps identify which version produces clearer, more consistent, and more actionable responses.
This approach removes guesswork from survey design. Instead of choosing a question because it “sounds better,” researchers can rely on actual respondent behavior to determine which version works best.
Why Split-Sample Testing Matters
Every survey decision influences the quality of the data you collect. Even small adjustments can improve completion rates, reduce bias, and encourage respondents to provide more thoughtful answers.
Split-sample testing helps researchers make those improvements before launching a survey at full scale.
(1) It Reveals the Impact of Question Wording
The way a question is written can change how respondents interpret it.
Leading language, vague wording, or technical jargon often produces inconsistent or misleading responses. Testing different versions helps researchers identify the wording that respondents understand most clearly.
As a result, the final survey produces cleaner and more reliable data.
(2) It Reduces Survey Bias
Bias can enter a survey in many forms, including leading questions, emotionally loaded language, and assumptions built into the question itself.
For instance, asking:
“How much did our excellent customer service help you today?”
already assumes the service was excellent.
A more neutral version such as:
“How would you rate the customer service you received today?”
allows respondents to answer honestly without being influenced by the wording.
Split-sample testing helps researchers detect these subtle biases before they affect the final results.
(3) It Improves Survey Completion Rates
Long or confusing surveys often lead respondents to abandon the questionnaire before reaching the final page.
By testing different survey lengths, layouts, or question sequences, researchers can discover which version keeps respondents engaged from beginning to end.
Higher completion rates typically lead to more representative data and stronger research findings.
(4) It Supports Better Business Decisions
Organizations regularly use survey data to make important decisions about products, marketing campaigns, customer service, pricing strategies, and employee experience.
If the survey itself contains design flaws, those decisions may be based on unreliable information.
Split-sample testing reduces that risk by ensuring decisions are supported by validated survey designs rather than assumptions.
(5) It Creates a Better Respondent Experience
A well-designed survey feels effortless to complete.
Clear instructions, logical question flow, mobile-friendly layouts, and concise wording all contribute to a positive respondent experience.
Testing different survey designs allows researchers to identify which version respondents find easiest to complete, increasing both participation and data quality.
Common Use Cases for Split-Sample Testing
Split-sample testing is widely used across industries because almost every organization relies on feedback to improve products, services, and customer experiences.
Here are some of the most common applications.
(1) Customer Satisfaction Surveys
Companies frequently test different satisfaction questions to determine which wording generates more accurate feedback.
For example, one version might ask customers to rate their overall experience, while another focuses on how likely they are to recommend the company. Comparing the responses helps researchers identify the metric that provides the most useful business insights.
(2) SaaS Product Onboarding
Software companies often experiment with onboarding forms to increase user signups.
Variables that are commonly tested include:
- Number of form fields
- CTA button text
- Progress indicators
- Multi-step versus single-page forms
- Optional versus required fields
Even small improvements in these areas can increase signup conversions while maintaining a smooth user experience.
(3) Payment and Checkout Forms
Abandoned checkout forms represent lost revenue.
Businesses often compare different checkout experiences by testing:
- Guest checkout versus account creation
- Single-page versus multi-page checkout
- Different payment options
- Trust badges and security messaging
- Form layouts
The goal is to identify the version that minimizes friction and encourages more customers to complete their purchases.
(4) Email Subscription Forms
Growing an email list often requires ongoing experimentation.
Researchers may compare:
- Different headlines
- CTA button wording
- Form placement
- Number of required fields
- Incentive offers such as downloadable guides or discounts
The results reveal which version encourages the highest subscription rate.
(5) Employee Feedback Surveys
Organizations also use split-sample testing internally.
For example, HR teams may compare anonymous and non-anonymous survey formats to determine which approach encourages more honest employee feedback while maintaining strong participation rates.
In the next section, we’ll look at exactly how to design and run a split-sample survey experiment, from defining your objective to analyzing the results and identifying the winning version.
How Split-Sample Testing Works in Practice
Although split-sample testing sounds technical, the process is straightforward when approached systematically. The objective is to change one variable at a time, observe how respondents react, and use the findings to improve future surveys.
Here’s a step-by-step guide to running a successful split-sample test.
(1) Define Your Objective
Every successful experiment starts with a clear question.
Rather than testing a survey simply to see “what happens,” identify the specific outcome you want to improve.
Your objective might be to:
- Increase survey completion rates
- Improve response quality
- Reduce survey abandonment
- Increase email signups
- Encourage more product trial registrations
- Reduce question bias
- Improve customer satisfaction scores
Having a clear objective helps you decide what to test and how you’ll measure success.
For example, if you’re creating a customer feedback survey after a product purchase, your goal might be to increase the percentage of customers who complete the survey. Everything else in the experiment should support that objective.
(2) Choose One Variable to Test
One of the biggest mistakes researchers make is changing too many things at once.
Suppose you decide to change the survey title, button color, question wording, page layout, and incentive simultaneously. If the new version performs better, you won’t know which change actually made the difference.
Instead, test only one variable during each experiment.
Common variables include:
- Question wording
- Survey length
- Response options
- Question order
- Form layout
- Progress bars
- Call-to-action buttons
- Incentives
- Required versus optional fields
Testing one element at a time produces cleaner, easier-to-interpret results.
(3) Create Two or More Survey Versions
Next, build multiple versions of the survey.
Each version should remain identical except for the single element being tested.
For example:
Version A
“How satisfied are you with our customer support?”
Version B
“Overall, how would you rate your customer support experience?”
Everything else should remain exactly the same.
This allows you to confidently attribute any differences in responses to the wording alone.
(4) Divide Respondents Randomly
Random assignment is essential.
Respondents should be distributed evenly across the survey versions so every participant has an equal chance of receiving any variation.
Randomization minimizes bias and helps ensure both groups are statistically comparable.
For example, if Version A is mostly shown to returning customers while Version B is shown to new customers, differences in results may reflect audience characteristics rather than survey design.
(5) Launch the Surveys Simultaneously
Timing matters more than many researchers realize.
Running Version A this week and Version B next month introduces external factors that may affect the outcome.
Customer behavior can change because of:
- Seasonal trends
- Marketing campaigns
- Product updates
- Holidays
- Economic conditions
- Industry events
Launching all versions during the same period helps eliminate these outside influences.
(6) Monitor Performance Throughout the Test
As responses begin to come in, monitor the metrics that align with your objective.
For example, you may track:
- Response rate
- Completion rate
- Drop-off rate
- Average completion time
- Quality of open-ended responses
- Conversion rate
- Error rate
Avoid declaring a winner too early.
Sometimes early trends disappear as more responses are collected.
Allow the survey to reach an adequate sample size before drawing conclusions.
(7) Analyze the Results
Once enough responses have been collected, compare the performance of each version.
Instead of focusing on one metric alone, look at the overall picture.
Imagine one survey version receives slightly fewer responses but significantly higher-quality answers with almost no incomplete submissions.
In many situations, that version provides more valuable data than one with a higher response rate but poor-quality responses.
Where possible, use statistical significance testing to determine whether observed differences are meaningful rather than the result of random chance.
(8) Implement the Winning Version
After identifying the best-performing variation, apply those improvements to future surveys.
Split-sample testing should not be viewed as a one-time activity.
Organizations that consistently collect high-quality data treat experimentation as an ongoing process, continually refining their surveys as respondent behavior changes over time.
How to Design Effective Split-Sample Survey Experiments
Running a split-sample test is relatively simple. Designing an experiment that produces trustworthy results requires more planning.
The following best practices will help ensure your findings are both reliable and actionable.
(1) Start with a Clear Hypothesis
A hypothesis provides direction for your experiment.
Instead of making random changes, predict how a specific adjustment will affect survey performance.
For example:
- Shortening the survey will increase completion rates.
- Simpler wording will reduce respondent confusion.
- Adding a progress bar will reduce survey abandonment.
- Offering a small incentive will increase participation.
Having a hypothesis makes it easier to evaluate whether the experiment achieved its intended outcome.
(2) Select an Appropriate Sample Size
Sample size directly affects the reliability of your findings.
Testing a survey with only a handful of respondents increases the likelihood that your conclusions are based on chance rather than actual differences.
Larger samples generally produce more dependable results because they better represent your target audience.
If possible, calculate the minimum sample size needed before launching the experiment.
(3) Keep Your Audience Consistent
Your audience should remain as similar as possible across all survey versions.
For example, if you’re studying customer satisfaction among first-time buyers, every version of the survey should target first-time buyers.
Mixing different respondent groups introduces unnecessary variables that can distort the results.
Consistency helps ensure you’re measuring the effect of the survey itself rather than differences between audiences.
(4) Use Reliable Survey Software
Managing multiple survey versions manually increases the risk of mistakes.
Using a platform like Formplus allows you to create professional surveys, duplicate forms for testing, organize responses efficiently, and analyze submissions in one place.
Features such as conditional logic, customizable forms, response analytics, and secure data collection also make it easier to conduct structured survey experiments without unnecessary complexity.
(5) Document Every Change
Keep a record of every variation you test.
This documentation should include:
- The objective of the experiment
- The variable being tested
- Sample size
- Test duration
- Performance metrics
- Final outcome
Maintaining detailed records helps prevent repeating unsuccessful experiments and provides valuable insights for future optimization efforts.
(6) Repeat the Process
Survey optimization is an ongoing process.
As customer expectations evolve and new products or services are introduced, survey performance can change.
Regular testing ensures your questionnaires continue to produce accurate, relevant, and high-quality insights over time.
Key Metrics to Measure in Split-Sample Tests
Running a split-sample test is only worthwhile if you know how to evaluate the results. Looking beyond the number of responses helps you understand how respondents interacted with each version of the survey and whether your changes actually improved the experience.
Here are the most important metrics to monitor.
(1) Response Rate
The response rate measures the percentage of people who completed your survey out of everyone who received an invitation.
For example, if 1,000 people receive your survey and 320 respond, your response rate is 32%.
A higher response rate often indicates that your survey invitation, title, timing, or overall design successfully encouraged participation.
When comparing two survey versions, ask yourself:
- Which version attracted more respondents?
- Did changing the survey invitation improve participation?
- Did a different email subject line generate more opens and responses?
These insights can help you improve future survey campaigns.
(2) Completion Rate
Getting respondents to start a survey is only half the challenge. The real goal is encouraging them to finish it.
Completion rate measures the percentage of respondents who answered every required question after beginning the survey.
A low completion rate may indicate that:
- The survey is too long.
- Certain questions are confusing.
- The form contains unnecessary fields.
- The survey experience feels overwhelming.
If Version A has a completion rate of 92% while Version B finishes at 76%, there’s a strong indication that Version A offers a smoother respondent experience.
(3) Drop-Off Rate
Drop-off rate measures where respondents abandon the survey before reaching the final question.
This metric helps identify friction points that may otherwise go unnoticed.
For instance, imagine most respondents leave immediately after reaching Question 12.
That question may be:
- Too personal
- Poorly worded
- Difficult to understand
- Too time-consuming
- Asking for information respondents don’t have readily available
Identifying these drop-off points allows researchers to redesign problematic sections instead of assuming the entire survey is ineffective.
(4) Average Completion Time
Completion time shows how long respondents spend answering the survey.
While shorter completion times are often desirable, they should not come at the expense of thoughtful responses.
If one version takes considerably longer than another, investigate why.
Perhaps:
- Instructions are unclear.
- Questions require excessive reading.
- The survey contains redundant questions.
- Navigation isn’t intuitive.
The ideal survey is efficient without feeling rushed.
(5) Response Quality
Not all responses carry the same value.
A survey with thousands of incomplete or careless responses provides less insight than one with fewer but higher-quality answers.
Evaluate response quality by considering:
- Completeness of answers
- Consistency across related questions
- Thoughtfulness of open-ended responses
- Frequency of straight-lining on rating scales
- Signs of random clicking or inattentive responding
Improving response quality often has a greater impact than simply increasing response volume.
(6) Conversion Rate
Many online surveys are designed to encourage a specific action after completion.
For example, respondents may be asked to:
- Sign up for a newsletter
- Download an ebook
- Start a free trial
- Request a product demonstration
- Register for an event
Conversion rate measures how many respondents complete that desired action.
If your survey is part of a marketing or lead generation campaign, conversion rate becomes one of the most valuable performance indicators.
Real-World Examples of Split-Sample Testing
Understanding the theory is helpful, but seeing how organizations apply split-sample testing in practice makes the concept much easier to understand.
Example 1: Testing Customer Satisfaction Questions
An online retailer wants to improve its post-purchase survey.
Version A asks:
“How satisfied are you with your recent purchase?”
Version B asks:
“Overall, how would you rate your shopping experience?”
After collecting responses from both groups, the company discovers that Version B produces more detailed comments and fewer skipped responses.
As a result, they adopt Version B for future customer satisfaction surveys.
Example 2: Comparing Survey Length
A software company believes its onboarding survey is discouraging new users because it contains too many questions.
They create two versions:
- Version A contains 15 questions.
- Version B contains 8 carefully selected questions.
Although both versions collect useful feedback, the shorter survey achieves a significantly higher completion rate with only a minimal reduction in data quality.
The company decides that collecting slightly less information from more respondents is a worthwhile trade-off.
Example 3: Testing Incentives
A nonprofit organization wants to increase participation in an annual community survey.
One group receives no incentive.
Another group is entered into a prize draw after completing the survey.
The incentive group records a noticeably higher response rate without reducing response quality.
The organization decides to include similar incentives in future surveys while ensuring they remain appropriate for the research objectives.
Example 4: Optimizing Online Forms
A SaaS company wants more visitors to complete its free trial registration form.
Using Formplus, the team creates two versions of the signup form.
Version A requests only essential information such as name, email address, and company name.
Version B includes several additional qualification questions before users can submit the form.
After monitoring completion rates and conversion data, the team discovers that the shorter form generates substantially more registrations.
Rather than relying on assumptions, they use actual user behavior to guide their decision.
Common Mistakes to Avoid When Running Split-Sample Tests
Even well-designed experiments can produce misleading results if basic testing principles are ignored.
Here are some of the most common mistakes researchers should avoid.
(1) Testing Too Many Variables at Once
Changing several elements simultaneously makes it impossible to determine which change influenced the results.
Always isolate one variable whenever possible.
(2) Using an Inadequate Sample Size
Small samples increase the likelihood that differences occur purely by chance.
Before launching your experiment, estimate whether your sample size is large enough to produce meaningful findings.
(3) Ending the Test Too Early
Early results can be misleading.
A survey version that performs well after the first 100 responses may not remain the strongest performer after 2,000 responses.
Allow sufficient time for responses to accumulate before drawing conclusions.
(4) Ignoring Statistical Significance
A small difference between survey versions does not necessarily indicate a meaningful improvement.
Whenever possible, support your findings with appropriate statistical analysis instead of relying solely on percentages.
(5) Introducing Audience Bias
Ensure respondents are assigned randomly.
If different demographic groups receive different survey versions, your conclusions may reflect differences in the audience rather than the survey itself.
(6) Overlooking Data Quality
High response rates mean little if respondents are providing rushed, inconsistent, or low-quality answers.
Always review your data for duplicate responses, incomplete submissions, straight-lining, and other indicators of poor-quality data before interpreting the results.
Best Practices for Getting Reliable and Actionable Results
Split-sample testing is most effective when it’s part of a structured research process rather than a one-off experiment. Following a few proven practices can help you collect higher-quality data and make decisions with greater confidence.
(1) Set Clear Success Metrics Before You Begin
Before launching your survey, decide what success looks like.
Depending on your objective, success could mean:
- A higher response rate
- An increase in survey completions
- Fewer abandoned surveys
- Better-quality open-ended responses
- More conversions after survey completion
Defining these metrics upfront keeps your analysis focused and prevents you from drawing conclusions based on irrelevant data.
(2) Test One Change at a Time
It can be tempting to redesign an entire survey in one experiment, but doing so makes it difficult to identify which changes influenced the outcome.
If your goal is to improve completion rates, start by testing a single variable, such as shortening the survey or rewording one question. Once you’ve identified a winning version, move on to testing another element.
This incremental approach produces clearer insights and makes future improvements easier to replicate.
(3) Give the Test Enough Time
Ending a split-sample test too soon can lead to misleading conclusions.
For example, one survey version may appear to perform better after the first 100 responses, but that advantage could disappear as more participants complete the survey.
Whenever possible, allow your experiment to run until you’ve reached your target sample size. Patience leads to more dependable results.
Review Data Quality, Not Just Performance
Strong performance metrics don’t always translate into valuable insights.
Before deciding which survey version performed best, examine the quality of the responses.
Look for signs of poor-quality data, including:
- Incomplete submissions
- Duplicate responses
- Straight-lining across rating scales
- Contradictory answers
- Extremely short completion times that suggest respondents rushed through the survey
Choosing the version that produces cleaner, more thoughtful responses will benefit your research far more than simply selecting the version with the highest response rate.
(1) Document Your Findings
Every split-sample test provides an opportunity to learn something about your audience.
Keep a record of:
- Your research objective
- The hypothesis being tested
- The survey variations
- Sample size
- Test duration
- Performance metrics
- Key findings
- Final decision
Building a library of previous experiments helps your team avoid repeating unsuccessful tests and creates a valuable knowledge base for future projects.
(2) Continue Testing and Improving
Respondent behavior changes over time.
What works today may not produce the same results next year as customer expectations, technology, and user preferences evolve.
Treat split-sample testing as an ongoing optimization strategy rather than a one-time task. Small improvements made consistently can have a significant impact on data quality over the long term.
Run Better Survey Experiments with Formplus
Creating multiple survey versions doesn’t have to be complicated.
With Formplus, you can build professional surveys, duplicate forms for testing, and collect responses securely from different respondent groups. Its intuitive drag-and-drop builder makes it easy to experiment with question wording, form layouts, and survey structures without starting from scratch each time.
Formplus also includes features that simplify survey optimization, including:
- Conditional logic for creating personalized survey experiences
- Multi-page forms that improve navigation for longer surveys
- Custom branding to match your organization’s identity
- Mobile-friendly forms that work across devices
- Real-time analytics for tracking responses and completion rates
- Secure cloud storage for protecting respondent data
- Integrations with tools such as Google Sheets, Slack, Microsoft Teams, Zapier, and CRM platforms
Whether you’re conducting academic research, gathering customer feedback, running employee engagement surveys, or validating new product ideas, Formplus gives you the flexibility to design, test, and improve your surveys with confidence.
Conclusion
Great surveys aren’t created by chance. They’re refined through testing.
Split-sample testing gives researchers a practical way to evaluate different survey designs before committing to a single version. Instead of relying on assumptions, you can compare real respondent behavior to identify what improves participation, reduces bias, and produces more reliable insights.
From testing question wording and survey length to experimenting with layouts, incentives, and response scales, even small adjustments can lead to measurable improvements in data quality.
The key is to approach every experiment with a clear objective, test one variable at a time, use an appropriate sample size, and carefully analyze the results before making decisions.
As your audience, products, and business goals evolve, your surveys should evolve too. By making split-sample testing a regular part of your research process, you’ll collect more accurate data, make better-informed decisions, and create survey experiences that respondents are more willing to complete.
If you’re ready to design, test, and optimize your surveys, Formplus provides the tools you need to build professional forms, compare survey variations, and turn better data into smarter decisions.
Frequently Asked Questions
What is split-sample testing?
Split-sample testing is a research method where respondents are randomly divided into two or more groups, with each group receiving a different version of the same survey. Researchers then compare the results to determine which version performs better.
What is the purpose of split-sample testing?
The primary purpose is to improve survey design by identifying which questions, layouts, response scales, or other elements produce more accurate data, higher completion rates, and a better respondent experience.
What is the difference between split-sample testing and A/B testing?
The two concepts are closely related. A/B testing typically compares two versions of a webpage, email, or marketing asset to improve conversions, while split-sample testing applies the same experimental principle to surveys and questionnaires. In survey research, the focus is usually on improving data quality and reducing bias rather than increasing sales or clicks.
How large should a split-sample test be?
The ideal sample size depends on your research objective, expected response rate, and the level of statistical confidence you need. In general, larger samples produce more reliable and representative results than very small groups.
Can split-sample testing reduce survey bias?
Yes. By comparing different question wordings, response options, and survey structures, researchers can identify elements that unintentionally influence respondents and replace them with more neutral alternatives.
Which survey elements can be tested?
Researchers commonly test question wording, question order, survey length, response scales, page layouts, progress indicators, call-to-action buttons, incentives, and form fields. Testing one variable at a time makes it easier to identify what caused the change in performance.