-
The Zeigarnik Effect: Why People Abandon Surveys (and Fixes)

Have you ever left a task halfway, then found your mind drifting back to it hours later? You could not fully relax until it was done. That mental nagging is not a personal quirk. It is a documented psychological pattern called the Zeigarnik Effect, and it shapes how people behave when they take surveys. For…
-
Anonymous Surveys and Self-Censorship: Why People Hold Back
Imagine receiving a note with no name, no address, and no way to trace who sent it. The sender is completely anonymous. Survey researchers have long relied on this same idea: remove all identifying information, and respondents will feel free to tell the truth. Except it does not always work that way. Plenty of anonymous…
-
One-Click Polls vs Multi-Option Polls: Which Gets Better Engagement?
One-Click Polls vs Multi-Option Polls: Which Gets Better Engagement? Has this happened to you? You spend hours designing the perfect poll question, sharing and embedding across all your target channels. However, you get a trickle of responses with no meaningful data. If this sounds familiar its not news, and you are not alone. Marketers, researchers,…
-
The Peak-End Rule in Survey Research: Why Your Survey’s Ending Matters

The human brain remembers experiences in a strange way. We rarely recall every moment of an event. Instead, we hold on to a few key points. In survey research, this pattern has a name: the peak-end rule. Understanding it can change how you design every survey you run. What Is the Peak-End Rule? The peak-end…
-
River Sampling: What it is, Types & Examples

Sampling is undoubtedly a very important process in an investigation. Thanks to this process, the correct answers or the most actionable results can be obtained. That is why today we decided to learn more about river sampling so that you can evaluate if it is what you need for your project. River sampling is a…
-
Midpoint Bias In Surveys: Implication & Mitigation
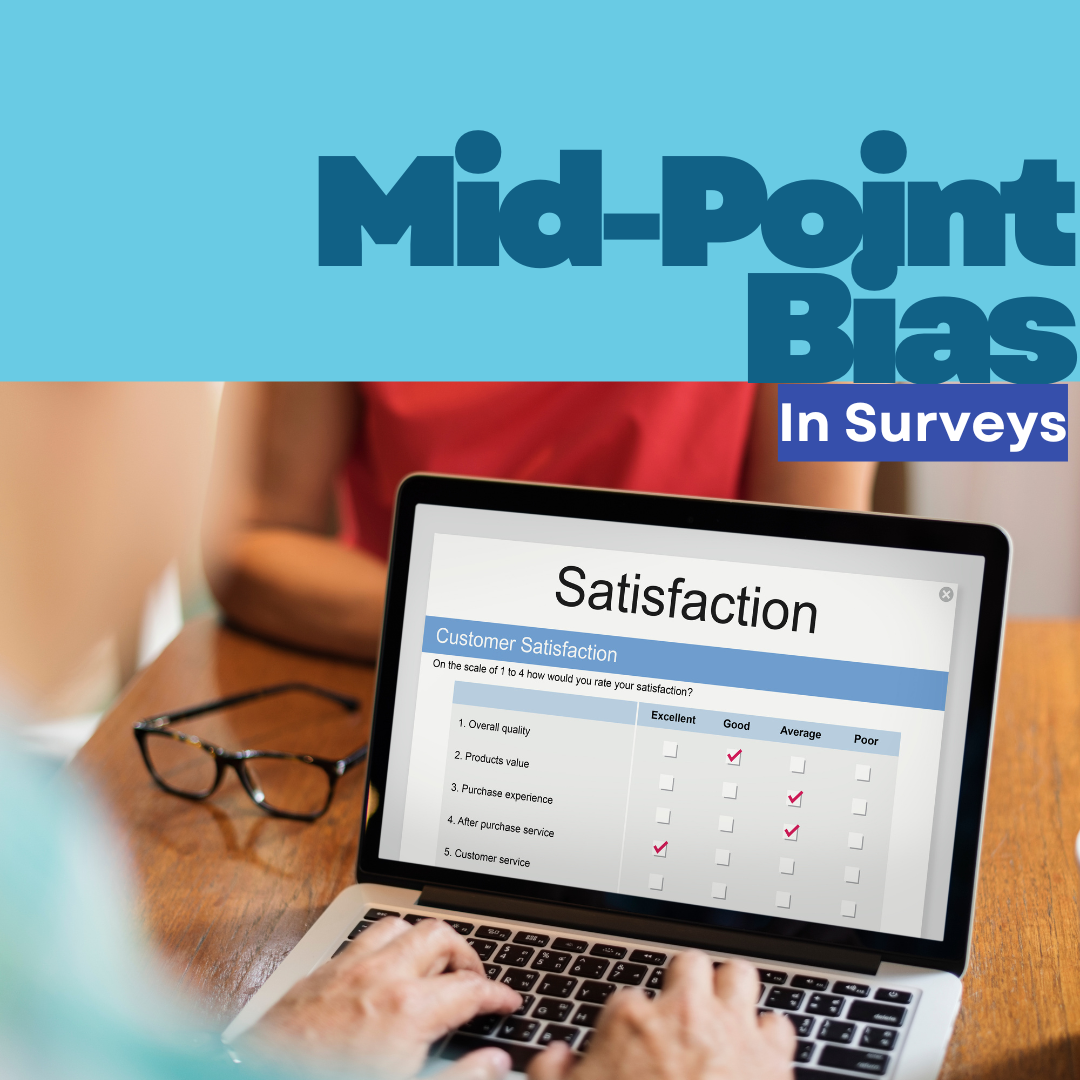
Finding surveys with questions like this after a purchase: “How satisfied are you?” is not new. Let’s say you’re in line at Starbucks, waiting for your coffee and praying you don’t miss the bus. Then someone approaches you with a nice smile rating card with “Very Dissatisfied” all the way up to “Very Satisfied.” You…
-
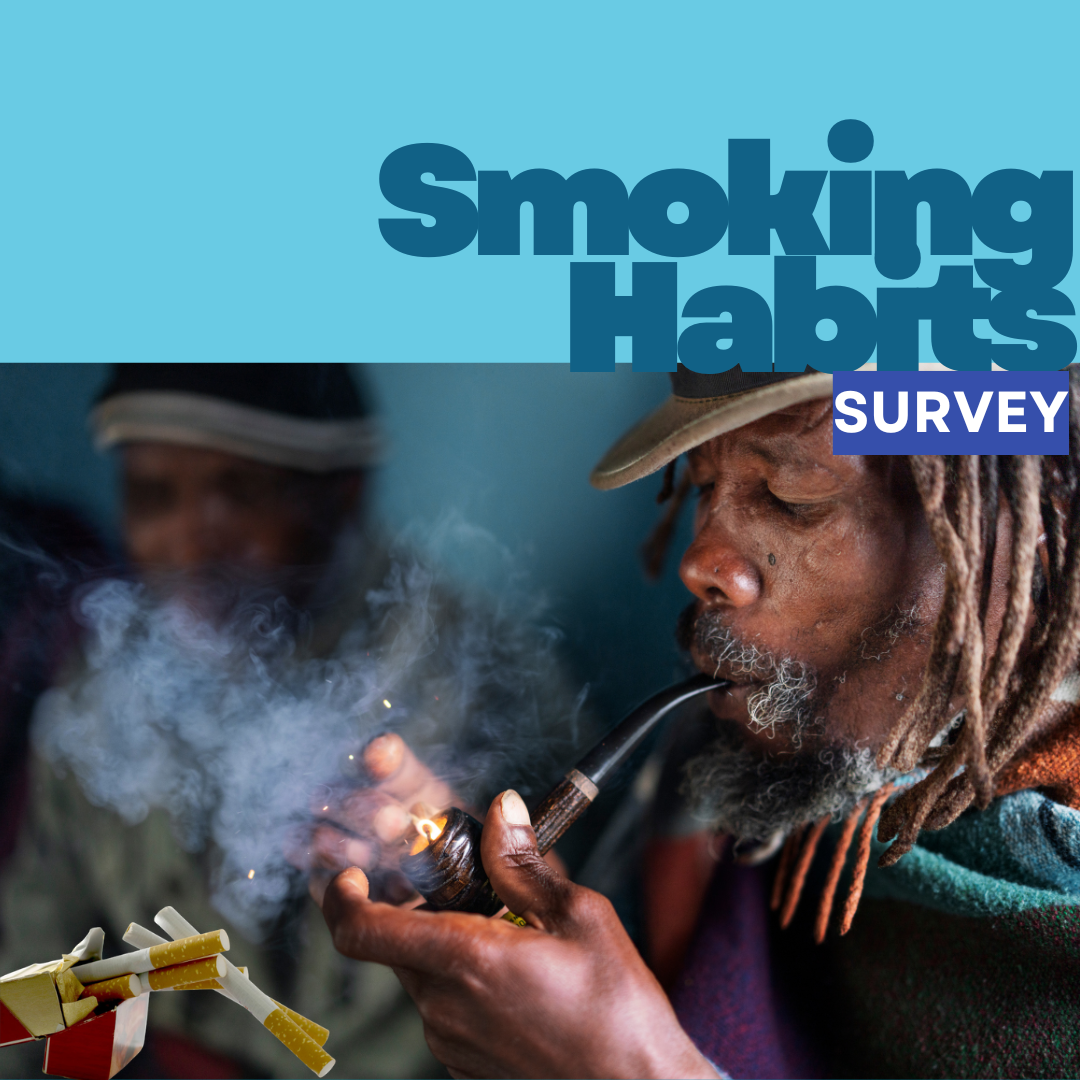
What Is a Smoking Habit Survey and Why Researchers Use It
-
How To Prevent Common Method Bias In Surveys
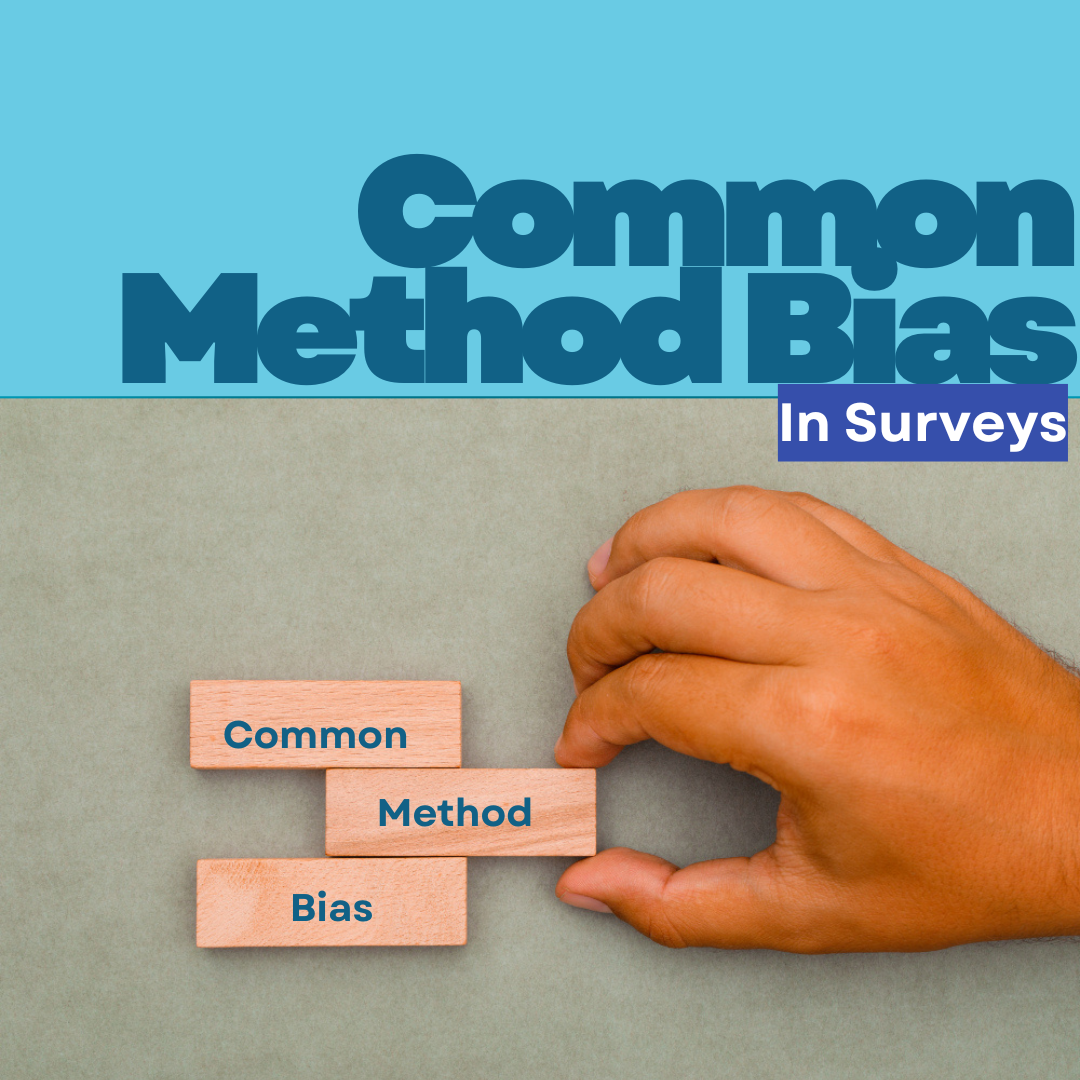
Why Common Method Bias Can Ruin Good Survey Data Have you ever experienced this? You create an attractive survey,well-written questions, and seamless logic. The responses are flowing in their hundreds, and yet you still come to an incorrect conclusion. The experience you just had is called the Common Method Bias (CMB). On the surface, your…
-
Courtesy Bias In Surveys and How to Prevent It
Have you ever wondered why you asked someone for their honest opinion about an outfit that looked terrible, only to have them say you looked good? You knew they were being untruthful, and they admitted it with a guffaw; you looked like a clown, but they just didn’t want to hurt your feelings. What you…
-
When NOT to Use Purposive Sampling (And What to Do Instead)
I want you to imagine you’re throwing a party… yes, stay with me, please, and you only invite people who can juggle oranges while reciting the national anthem. That’s kind of like purposive sampling in research; it’s all about handpicking participants who fit specific criteria because they bring something unique to the table. For research…